Let’s start downloading the OphidiaVM.
Import it inside the Virtual Box environment and start it.
Use the following credentials to login:
username: ophidia
password: ophidia
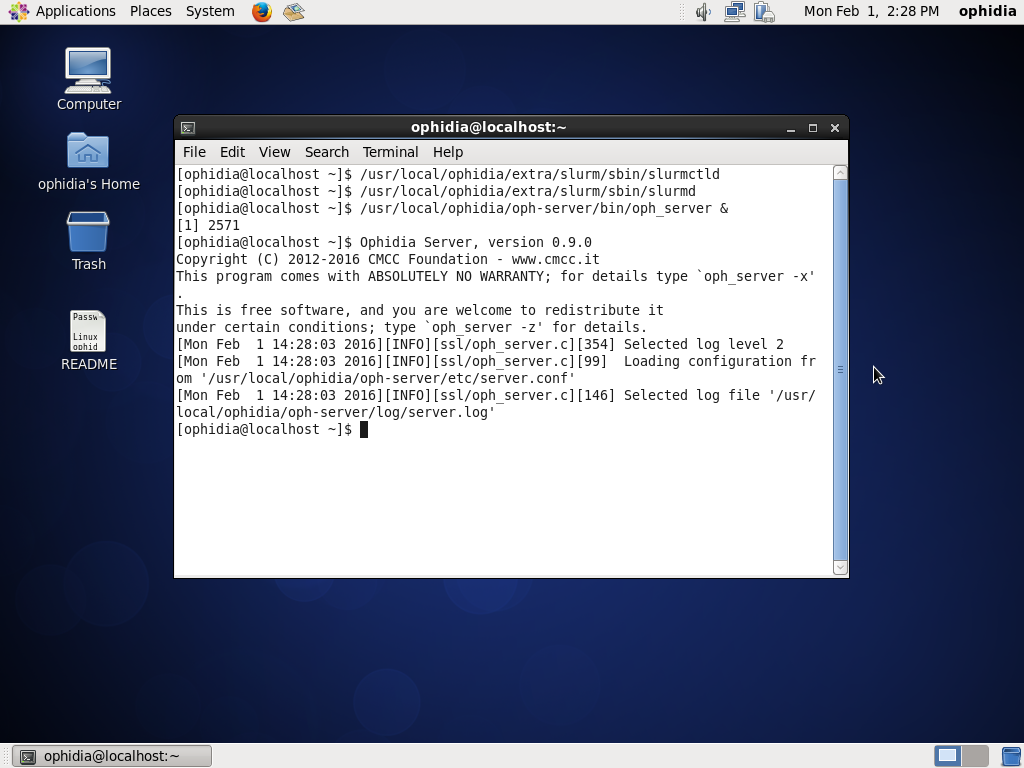
As ophidia user start the Ophidia Server using the command
/usr/local/ophidia/oph-server/bin/oph_server &

Now you are ready to run the Ophidia terminal.
oph_term -u <user> -p <password> -H <Ophidia_Server_IP> -P <Ophidia_server_port>

The default parameters are:
user = see the README file located under the Desktop folder of the Ophidia virtual machine
password = see the README file located under the Desktop folder of the Ophidia virtual machine
Ophidia_Server_IP = 127.0.0.1
Ophidia_server_port = 11732
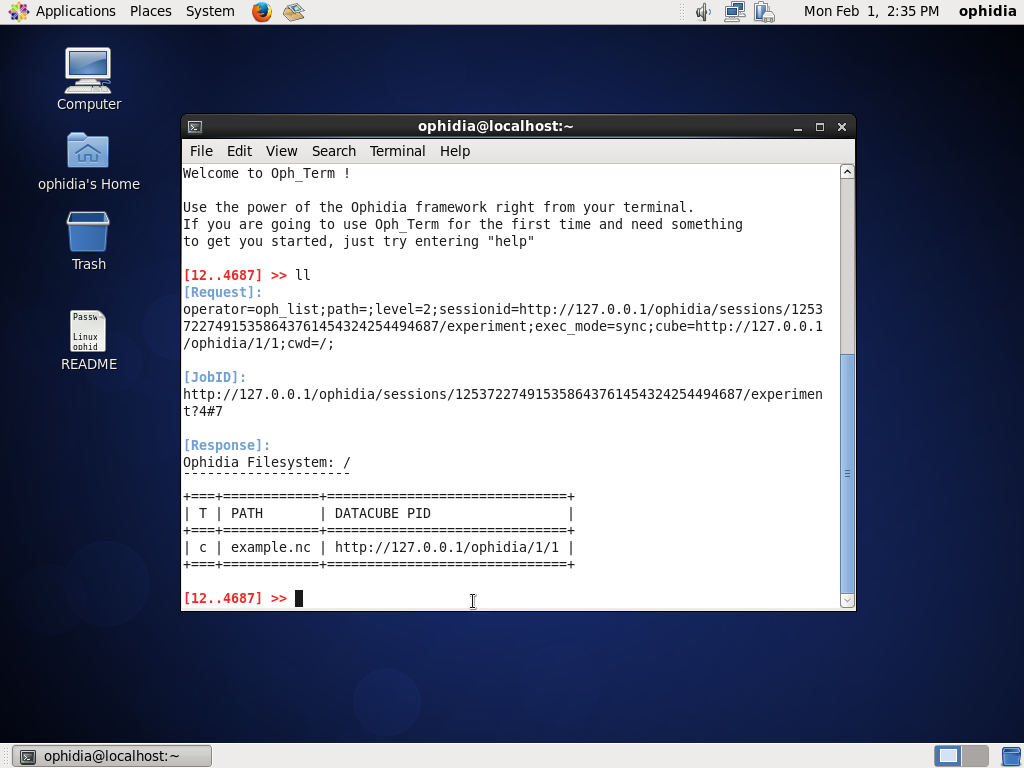
Let’s have a look at the data cubes in your environment:
ll
to list the data cubes and containers in your session.

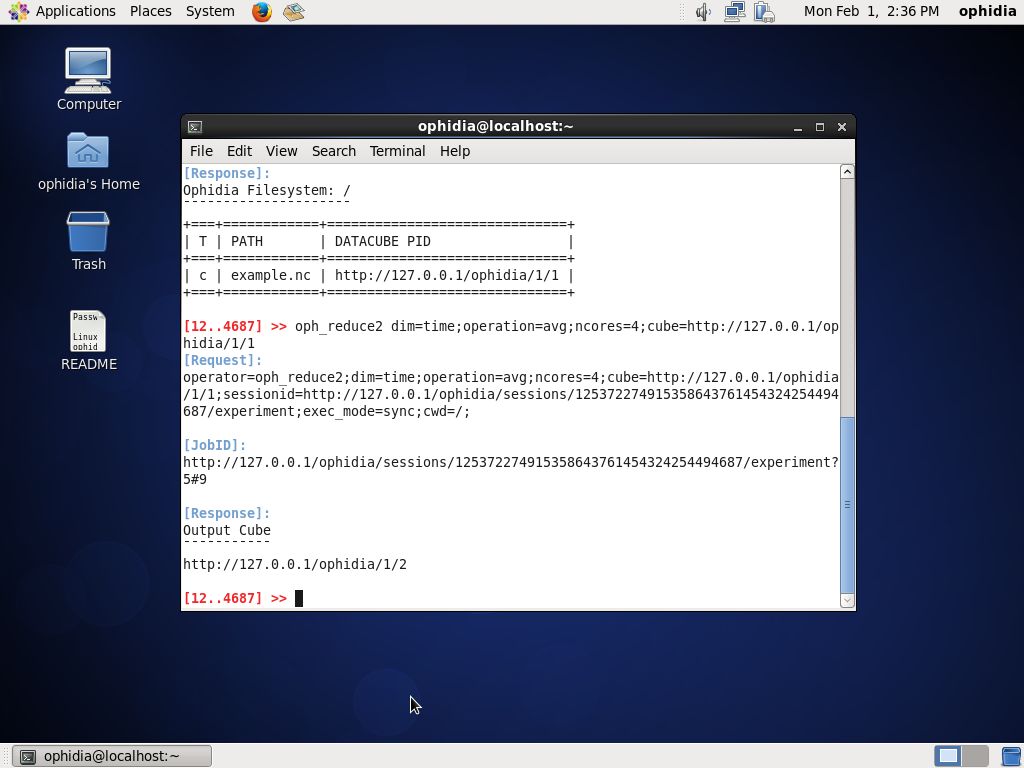
Now, you can submit your first operation of data transformation; let’s reduce the whole data cube in a single value for grid point using the average along the time:
oph_reduce2 dim=time;operation=avg;ncores=4;cube=<data_cube_PID>

By default the Ophidia terminal will use the last output data cube PID.
So, let’s use
oph_explorecube
to visualize the first 100 values.
For a more comprehensive test session, see Examples section.